
Marketing Metrics That Matter: Why Most Dashboards Mislead Teams
Let me tell you about the most expensive lie in digital marketing.
It's not the promise of overnight success. It's not the "one weird trick" in your inbox. It's the beautiful, colorful dashboard sitting in your weekly report that shows millions of impressions, thousands of clicks, and hundreds of engagements, while your business quietly bleeds money.
I've sat in too many boardrooms where executives beam at their "viral" campaign while their CFO quietly wonders why the marketing budget tripled but revenue stayed flat. I've watched startups celebrate 100K Instagram followers while running out of runway. I've seen Fortune 500 brands obsess over engagement rates while their customer acquisition costs silently killed profitability.
The problem isn't the data. It's what we're measuring.
The Vanity Metrics Trap

Here's the uncomfortable truth: most marketing metrics are designed to make marketers look good, not to drive business growth.
Impressions? Meaningless without conversion context.
Engagement rate? Irrelevant if it doesn't lead to revenue.
Click-through rate? Who cares if those clicks don't convert.
Follower count? Utterly useless if they won't buy.
These aren't insights. They're distractions dressed up as success.
I learned this the hard way managing a $2M annual budget for a luxury fashion brand. We had incredible metrics, millions of impressions, 4% CTR, engagement rates that would make any agency proud. But when the CEO asked, "Are we making money on this?" I realized I couldn't answer with confidence.
That's when I stopped reporting what looked good and started reporting what mattered.
The Only Metric Hierarchy That Matters
Business metrics exist in a hierarchy. Not all KPIs are created equal, and understanding this structure is the difference between strategic marketing and expensive busywork.
Tier 1: Business Health Metrics (The Non-Negotiables)
These are your North Star metrics—the numbers that determine whether your business lives or dies:
1. LTV:CAC Ratio (Lifetime Value to Customer Acquisition Cost)
This is the single most important metric in your entire dashboard. Period.
Below 1:1 = You're paying more to acquire customers than they'll ever pay you back. Stop everything.
1:1 to 3:1 = You're break-even to profitable, but there's no margin for error or growth investment.
3:1 to 5:1 = Healthy, sustainable growth. This is where you want to be.
Above 5:1 = You're likely underinvesting in growth. Scale up or competitors will.
Here's what this actually looks like:
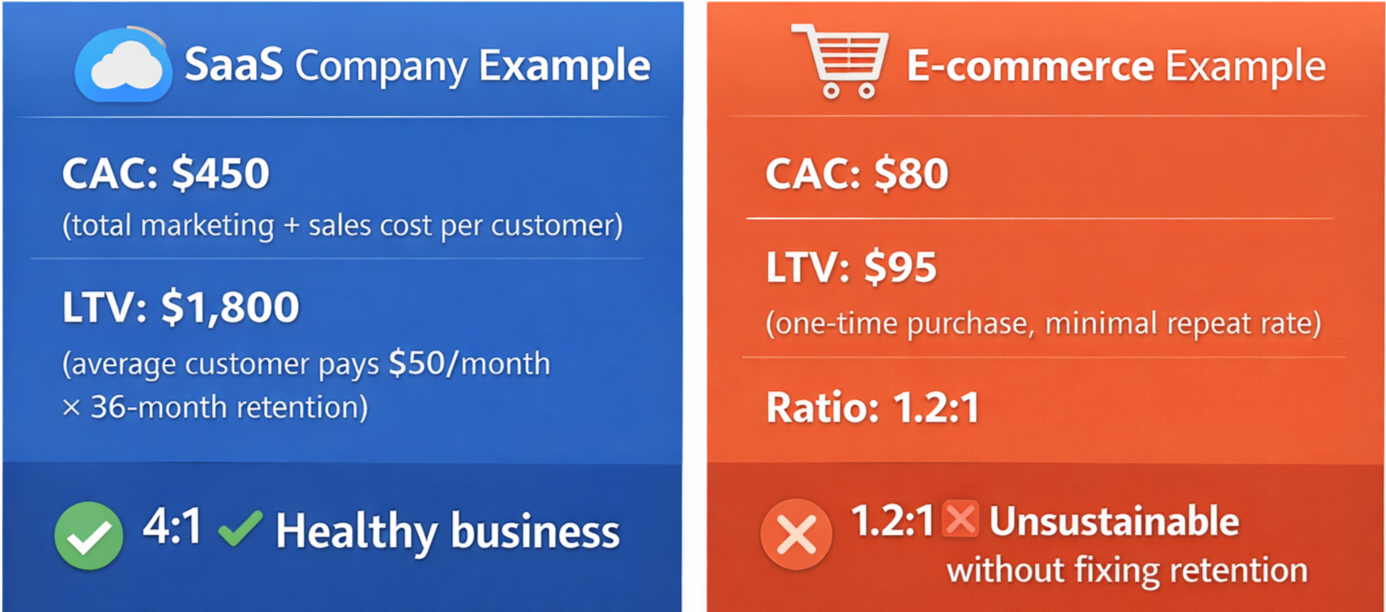
Why it matters: This single ratio tells you if your entire business model works. Everything else is details.
2. Contribution Margin by Channel
Revenue minus variable costs (COGS + direct marketing spend), broken down by acquisition source.
This reveals which channels actually make you money versus which ones just make you busy.
Channel Performance Reality Check:
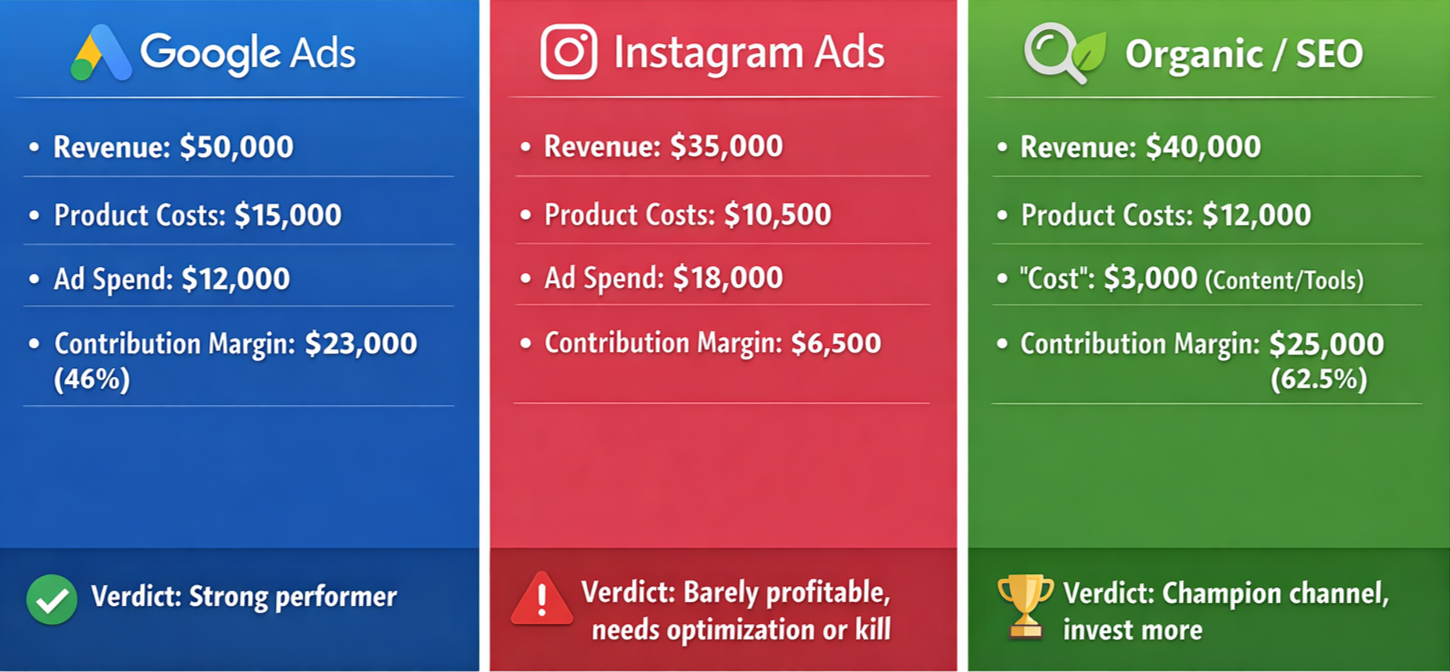
Most marketers report revenue by channel. Smart marketers report profit by channel. There's a massive difference.
3. Payback Period
How long does it take to recover your customer acquisition cost?
Less than 6 months: Excellent. You can scale aggressively.
6-12 months: Good for most businesses. Manageable cash flow.
12-18 months: Requires strong cash position and patient capital.
Over 18 months: Dangerous unless you have exceptional retention/LTV.
A 4:1 LTV:CAC ratio sounds great until you realize it takes 24 months to break even. That's a cash flow crisis waiting to happen.
Tier 2: Channel Performance Metrics (The Diagnostics)
Once your business fundamentals are solid, these metrics help you optimize execution:
4. ROAS by Campaign (Not Just Overall)
Looking at blended ROAS hides where you're actually making money. Break it down:
ROAS by campaign type (prospecting vs. retargeting)
ROAS by creative (what messages actually convert)
ROAS by audience segment (who's profitable vs. who's expensive)
ROAS by time (seasonality, day-parting, trend analysis)
Real example from a client: Overall ROAS was 3.2X (acceptable). But when we segmented:
Retargeting campaigns: 8.5X ROAS (amazing)
Cold prospecting: 1.4X ROAS (losing money)
Their "blended" metric was masking a serious problem.
5. Conversion Rate by Funnel Stage
The leaky bucket analysis:
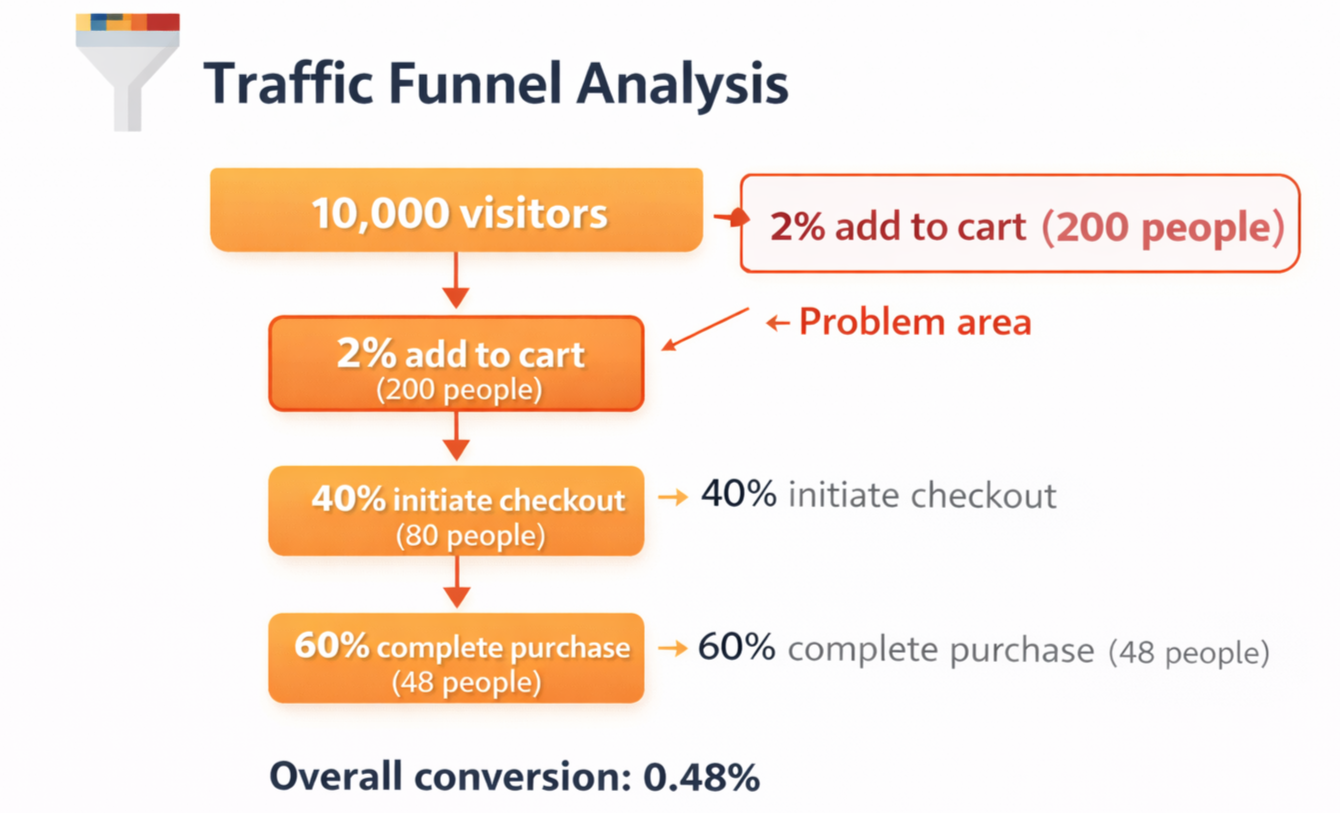
By fixing just the add-to-cart rate from 2% to 4%, you double revenue without spending another dollar on ads.
Don't just measure overall conversion rate. Measure every step. The biggest gains usually hide in the middle of your funnel, not at the top or bottom.
6. Retention Rate & Cohort Analysis
New customers are expensive. Retained customers are profitable.
Track cohorts by month/quarter of acquisition:
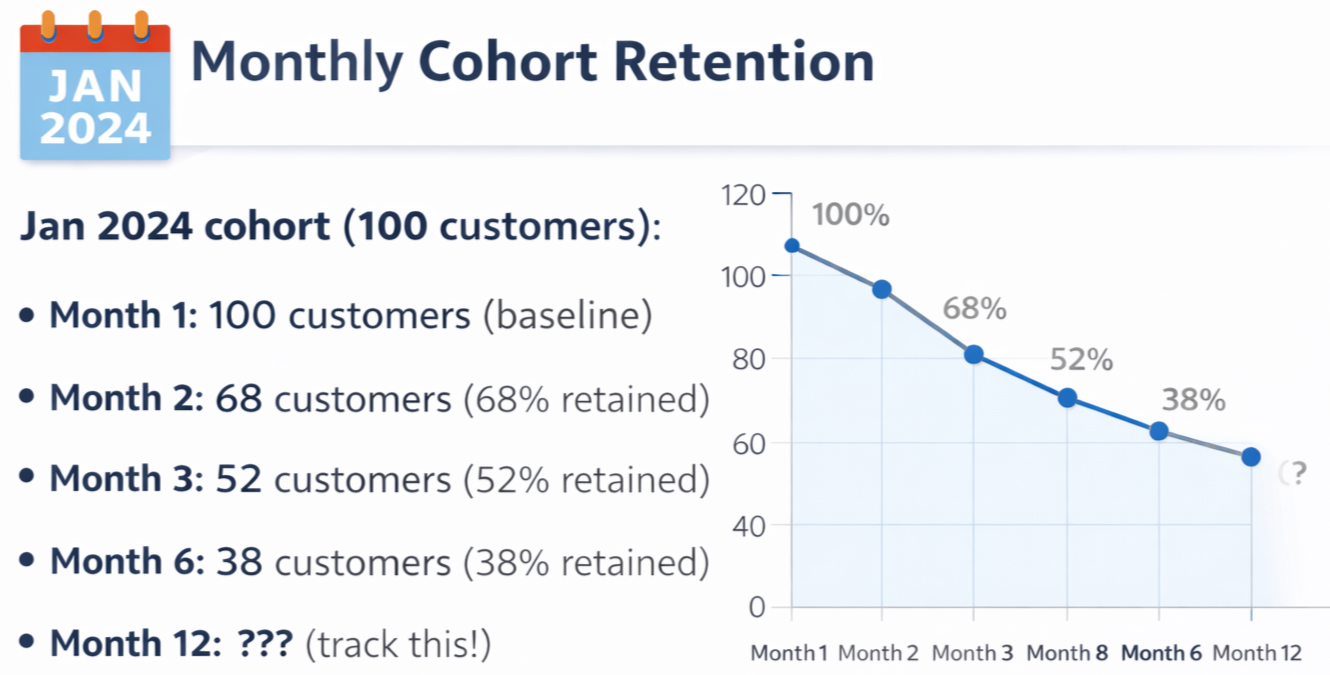
If different acquisition channels have different retention curves, that changes your CAC calculations entirely.
A 5% improvement in retention can increase profits by 25-95% depending on your business model. Yet most marketers spend 90% of their time on acquisition and 10% on retention.
The math is backwards.
Tier 3: Activity Metrics (The Context)
These only matter in context of Tier 1 & 2 metrics:
Impressions/Reach: Useful for brand awareness campaigns if you're tracking aided/unaided awareness separately
CTR: Diagnostic for creative testing, useless in isolation
Engagement Rate: Relevant only if engagement predicts conversion (test this assumption)
Traffic/Sessions: Meaningless without conversion and revenue data
Email Open Rate: Directional at best, click-to-conversion matters more
These aren't worthless. They're just not strategic. They're tactical dials you adjust after you've nailed your business fundamentals.
The Dashboard Structure That Actually Works
Here's the reporting framework I use with every client, from startups to enterprise:
The One-Page Weekly Dashboard
Section 1: Business Health (Top 25% of Page)
Revenue vs. Target
Contribution Margin %
New Customer CAC
LTV:CAC Ratio
Payback Period
If these numbers are green, read on. If they're red, nothing else matters until you fix them.
Section 2: Channel Performance (Middle 50%)
Revenue by channel
CAC by channel
ROAS by channel
Contribution margin by channel
Week-over-week and month-over-month trends
This shows you where to invest more and where to cut.
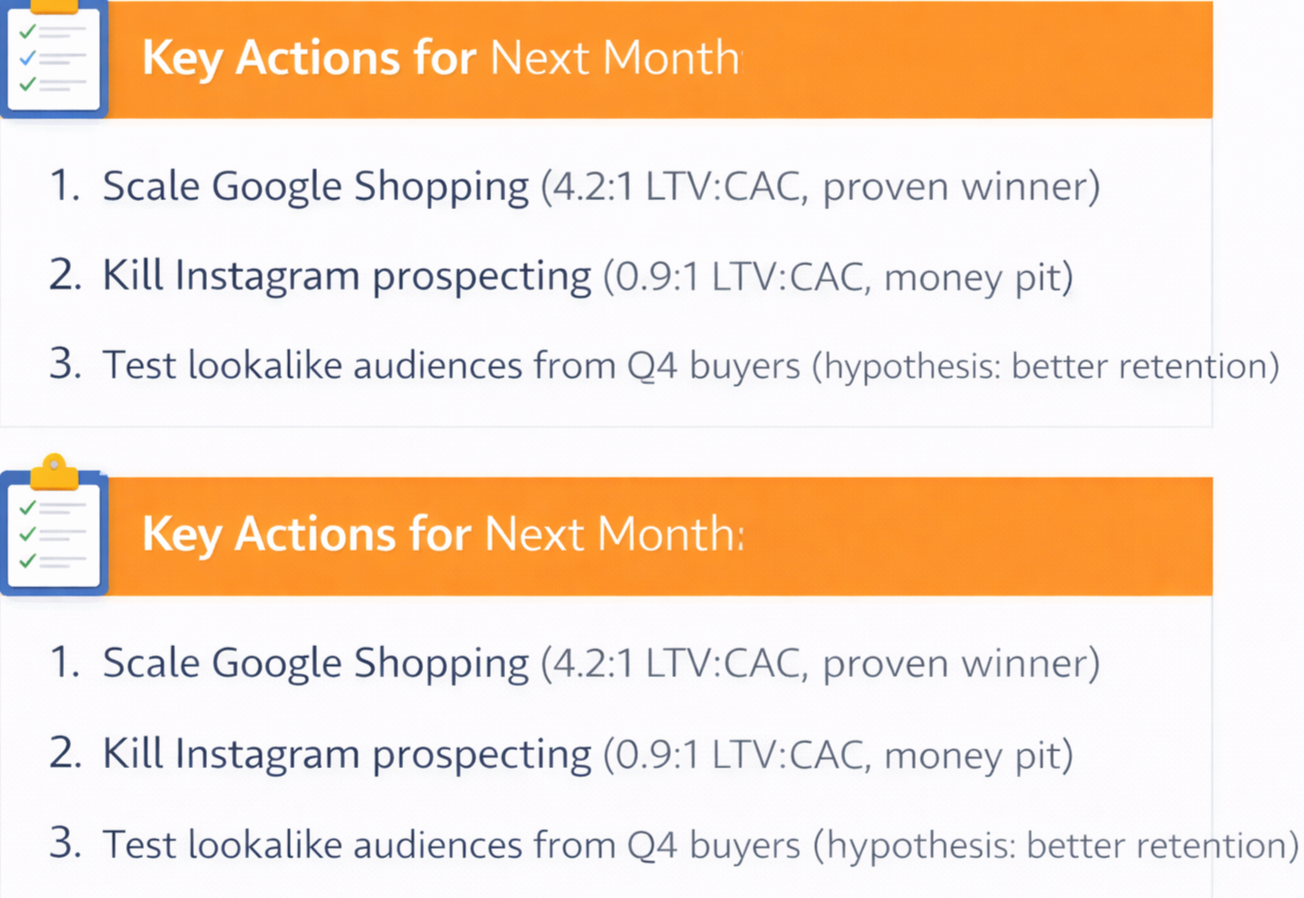
Section 3: Key Insights & Actions (Bottom 25%)
What's working and why (2-3 bullets)
What's not working and why (2-3 bullets)
Recommended actions for next week
No fluff. No vanity metrics. Just signal.
The Monthly Deep Dive
Once a month, go deeper:
Cohort analysis: How are customer cohorts performing over time?
Attribution analysis: What's the true customer journey?
Creative performance: Which messages/offers are winning?
Competitive benchmarking: How do our metrics compare to industry standards?
Forecasting: Based on current performance, where will we be in 3/6/12 months?
This is where you find strategic insights, not in your daily metrics noise.
The Common Measurement Mistakes (And How to Avoid Them)
Mistake #1: Last-Click Attribution Bias
Google Analytics gives Facebook credit. Facebook Ads Manager gives Facebook credit. The truth is usually somewhere in between.
The fix: Use multi-touch attribution or marketing mix modeling. At minimum, compare last-click to first-click attribution to understand the gap.
Mistake #2: Ignoring Time Lag
Your Meta ads might drive $10K in revenue today, but $15K of that revenue might have started from a Google ad two weeks ago.
The fix: Measure lag time from first touch to conversion. Adjust your attribution windows accordingly. Most platforms default to 7 days; your sales cycle might be 30-90 days.
Mistake #3: Not Accounting for Returns/Refunds
Your dashboard shows $100K in revenue. Your accounting team knows $12K came back as refunds.
The fix: Report net revenue (after returns) and track return rate by channel. Some acquisition sources might have 5% return rates, others 25%. This massively impacts real profitability.
Mistake #4: Comparing Unlike Things
"Our Instagram campaigns have a 2% conversion rate but Google has 4%, so Google is better."
But if Instagram brings in new customers and Google captures existing demand, you're comparing apples to spaceships.
The fix: Segment by new vs. returning customers, cold vs. warm traffic, prospecting vs. retargeting. Compare like to like.
Mistake #5: Falling for Platform-Reported Numbers
Facebook says you got 100 conversions. Google says you got 85. Your actual database shows 67 new customers.
The fix: Build your own source of truth. Track conversions in your CRM/database using UTM parameters. Reconcile platform-reported numbers with actual business outcomes monthly.
Mistake #6: Optimizing Metrics Instead of Outcomes
I've seen campaigns "optimized" to a 0.8% CTR that drove zero revenue. High CTR on the wrong audience is expensive failure, not success.
The fix: Start with the business outcome (revenue, profit, LTV) and work backward. Optimize for the outcome, not the intermediate metric.
What This Looks Like in Practice
Let me show you a real before/after from a B2C client in the home goods space:
Before: Vanity Metric Dashboard
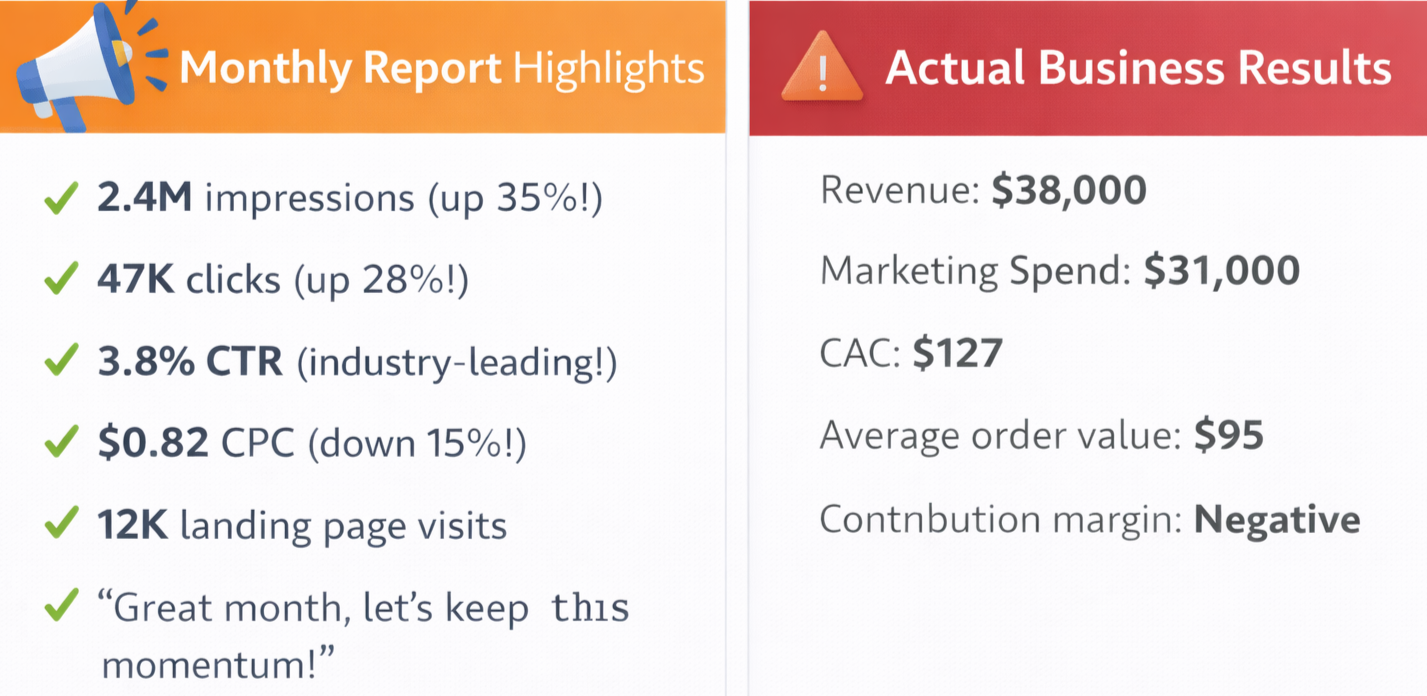
They were celebrating metrics while losing money on every customer.
After: Business Metrics Dashboard
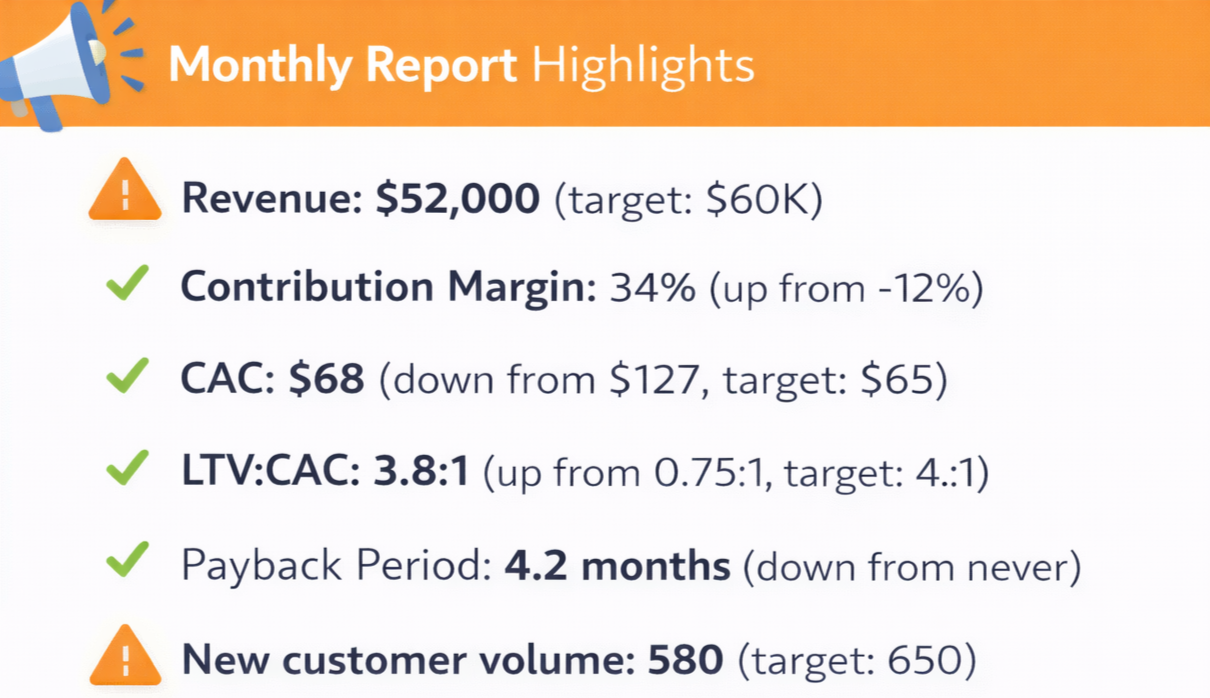
Same business, same marketing team, completely different narrative. And more importantly, actually profitable.
The shift? We stopped measuring activity and started measuring outcomes.
How to Implement This Tomorrow
You don't need to rebuild your entire analytics infrastructure overnight. Start here:
Week 1: Calculate Your Current LTV:CAC Ratio
Pull your total marketing spend for the last 12 months
Count how many customers you acquired in that period
Calculate your average customer lifetime value (or 12-month value as a proxy)
Divide LTV by CAC
If the number scares you, good. Now you know what to fix.
Week 2: Build Your One-Page Dashboard
Open a Google Sheet (yes, really, keep it simple)
Add the 5 business health metrics at the top
Add channel performance metrics in the middle
Leave space for insights/actions at the bottom
Update it weekly
Share it with stakeholders who actually make decisions
Week 3: Audit Your Current Metrics
For every metric you currently track, ask:
Does this directly impact revenue or profit?
Would this metric being "good" while the business fails make sense?
Can I take action based on this metric?
If the answer is "no" to all three, stop reporting it.
Week 4: Start Cohort Tracking
Tag customers by acquisition month and channel
Track their behavior over time (purchases, retention, LTV)
Compare cohorts to find patterns
Use this to inform your CAC targets by channel
The Uncomfortable Conversation
Here's what happens when you shift to business metrics: you might discover you're not as good at marketing as your vanity metrics suggested.
Your "award-winning" campaign might have terrible ROI. Your "viral" content might drive zero revenue. Your "high-performing" channel might be profitable only because of unsustainable promotions.
This is uncomfortable. It's supposed to be.
Because once you see the truth, you can fix it. You can kill what's not working, double down on what is, and actually drive business growth instead of just generating reports that look impressive.
The Bottom Line
Marketing exists to drive profitable business growth. Not to generate impressive dashboards. Not to win awards. Not to accumulate followers or impressions or engagement.
The metrics that matter are the ones that answer three questions:
Are we making money? (LTV:CAC, contribution margin, ROAS)
How efficiently are we making it? (CAC by channel, payback period, retention rate)
Can we sustainably grow? (Cohort analysis, forecasting, incrementality)
Everything else is context, not strategy.
Your dashboard should make your CFO happy, not just your marketing team. If it doesn't, you're measuring the wrong things.
The brands that win don't have the best CTRs or the most followers. They have the best understanding of what drives actual business value—and they optimize relentlessly for that, not for metrics that make pretty charts.
Stop lying to yourself with vanity metrics. Start measuring what matters.
Your business - and your budget - will thank you.
Ready to transform your marketing from cost center to profit driver? The metrics framework in this post is exactly what I use with clients to identify hidden profit opportunities and eliminate waste. If your dashboard is full of green numbers but your business isn't growing, let's talk about what you're actually measuring—and what you should be. Let's work together.
This is part of a series on building marketing that actually drives business growth. For more on strategic marketing frameworks, check out our other posts on creative strategy, channel diversification, and sustainable growth.